AI Powered Fish and Water Monitoring API Platform
What began as personal frustration with scattered, outdated fishing information evolved into a sophisticated API infrastructure serving 352,000+ tracked fish across 14+ states, with real-time USGS water monitoring integration and machine learning capabilities.
Project objectives and approach
The objective of this project was simple but ambitious: normalize messy, fragmented fishing and water data across multiple states and make it easily accessible through modern APIs and dashboards.
As an angler who grew up fishing with my dad, I experienced first-hand the frustration of navigating scattered Game and Fish websites.
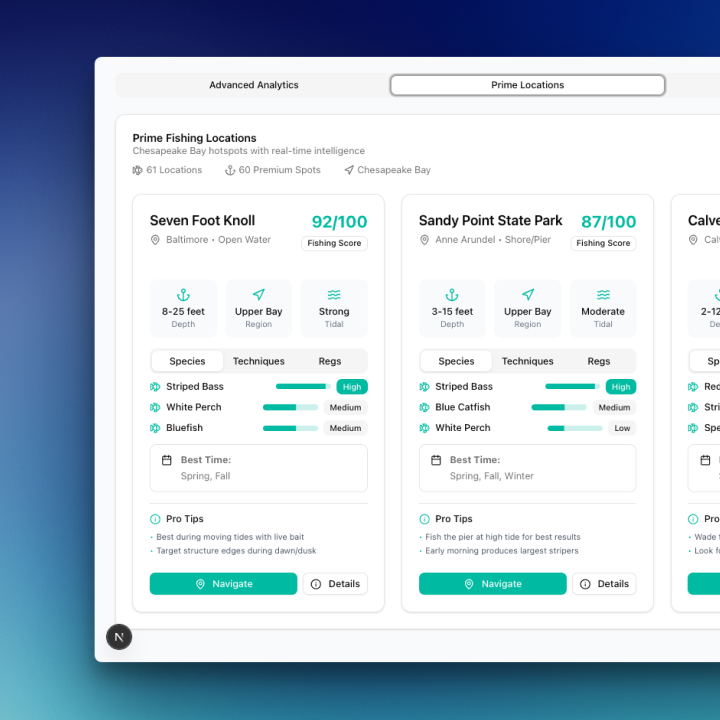
Each state had different structures for reports, stocking data, and regulations. The mission became to unify this data — stocking records, water body names, species, trophy potential, access points, seasons, and more — into a consistent platform.
The approach combined AI-powered research agents, in-cloud development environments, and iterative design.
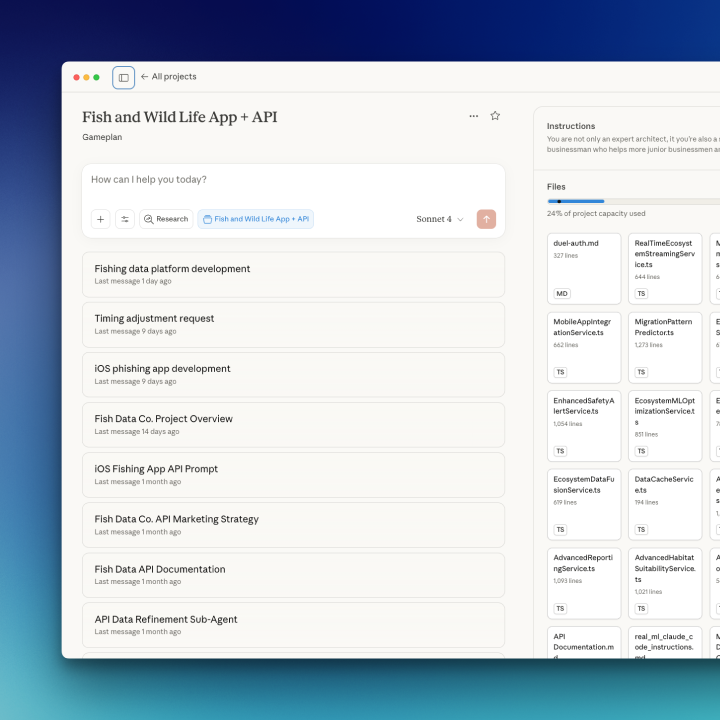
Starting with Claude Desktop and MCP servers, I mapped out data sources and quirks in Markdown files, then moved into Cursors IDE and Cloud Code to structure and build APIs, followed by testing, deployment, and dashboard design.


Technical architecture and implementation
The technical stack followed a sequential workflow:
- Claude Desktop + MCP Servers (Firecrawl, Playwright, Exa, Context7): for research, crawling ArcGIS and state databases, and generating structured Markdown documentation.
- Cursors IDE + Cloud Code: for infrastructure setup, schema normalization, and orchestrating sub-agents (like an api-data-quality-analyst) to validate and enhance data quality.
- GitHub + GitHub Actions: for version control and automated deployments.
- Railway: for hosting APIs in production.
- Postman: for endpoint validation (authentication, payload previews).
- Design Phase (shad-cn, Magic UI): dashboards grounded in real endpoints, with Magic UI for landing pages hosted on Vercel.
- Distribution: publishing APIs on RapidAPI for discoverability.
Challenges and solutions
Challenge 1: Data Fragmentation
Each state provided data differently — different schemas, naming conventions, coordinate systems, and levels of detail.
- Solution: Built sub-agents to handle schema mapping, null-checking, and normalization. Used plan mode in Cloud Code to align the project setup early, reducing costly refactoring later.
Challenge 2: Scaling Across States
Minnesota alone has 10,000+ lakes, while Alaska spans 665,000 square miles.
- Solution: Added caching, batching, and retry logic for ArcGIS queries. Deduplicated records and validated coordinates against state boundaries.
Challenge 3: Balancing Infrastructure and Design
It’s easy to focus solely on APIs and leave design as an afterthought.
- Solution: Passed actual API URLs into Claude Desktop during design brainstorming, ensuring dashboards and UI ideas were grounded in real data.
Challenge 4: Tool Overload
With so many tools (Claude Desktop, MCP servers, Cursors IDE, Cloud Code, GitHub, Postman, Railway, Magic UI, Vercel, RapidAPI), it could get overwhelming.
- Solution: Defined a clear sequential workflow (research → infra → testing → deployment → design → distribution) and reused MCP servers across environments for consistency.

Project outcomes and impact
The biggest outcome wasn’t just the infrastructure — it was showing what’s possible with today’s AI-powered tools. In a matter of weeks, I:
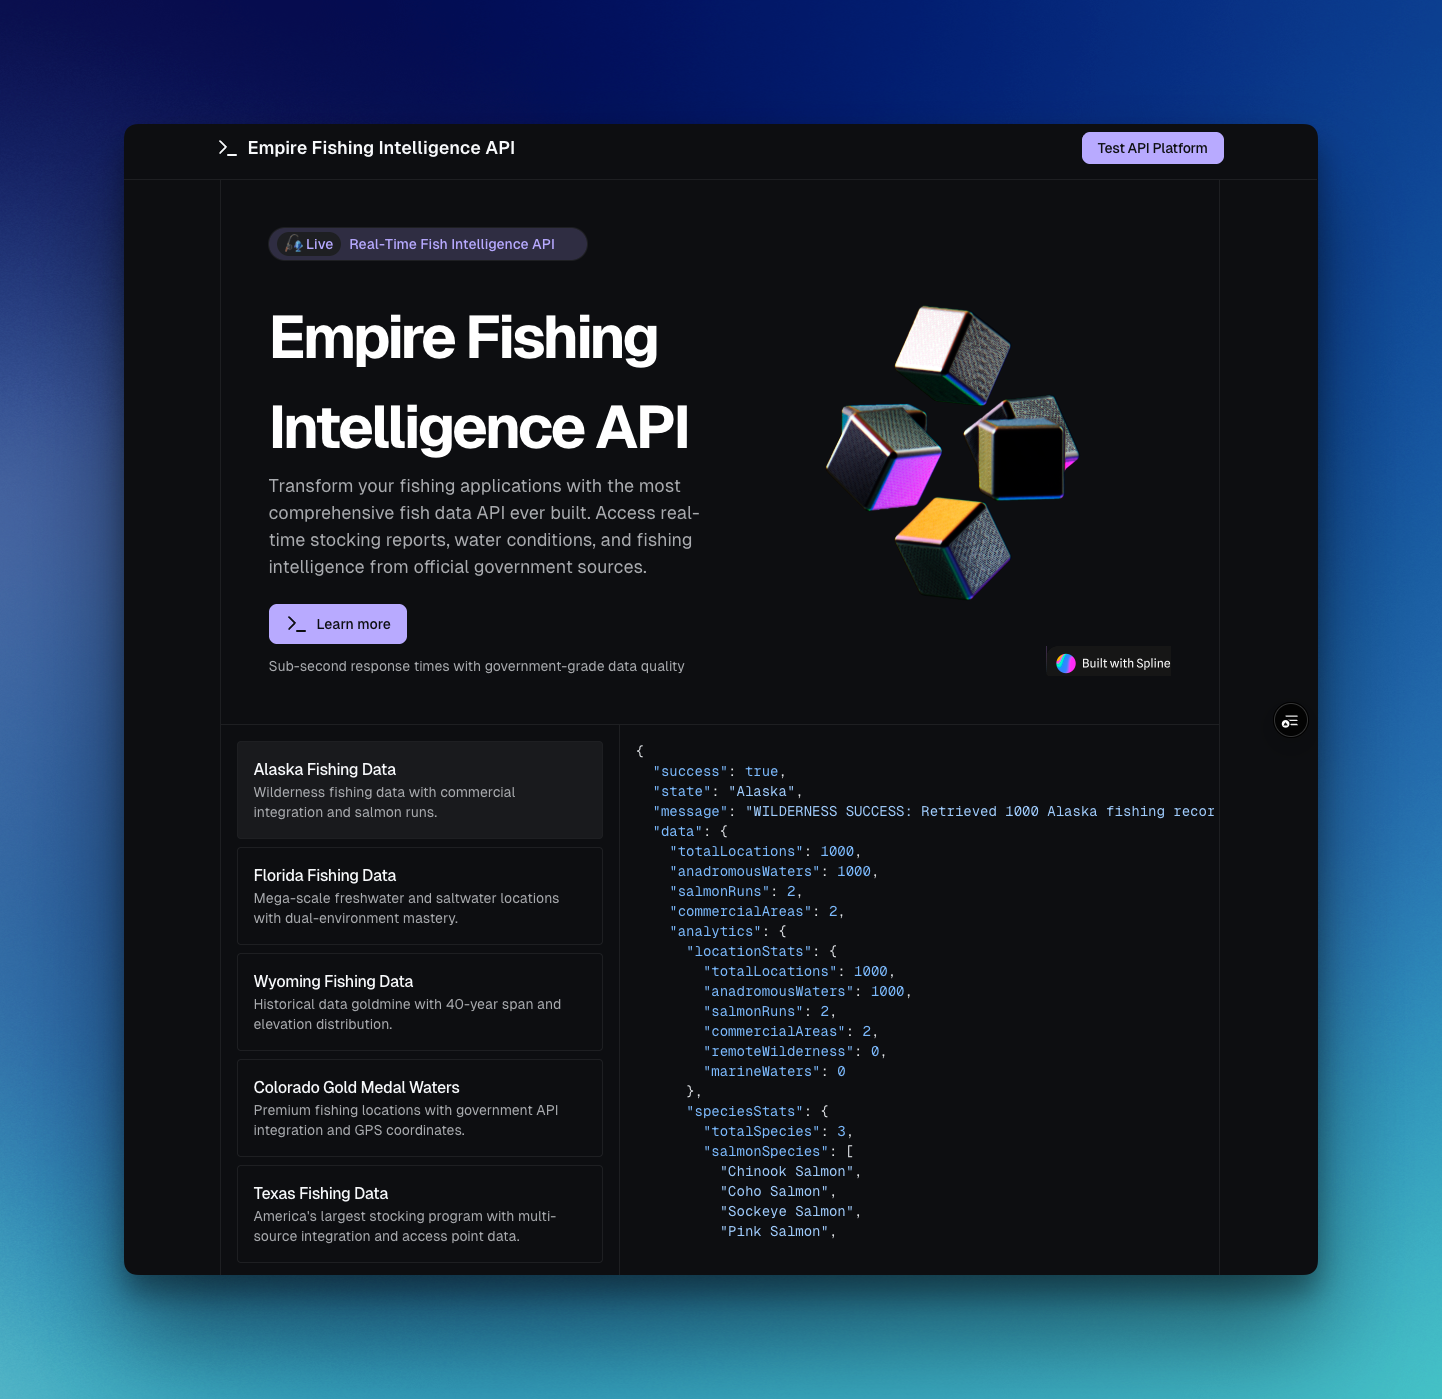
- Built multi-state fishing APIs hosted on Railway.
- Published them on RapidAPI for developer discovery.
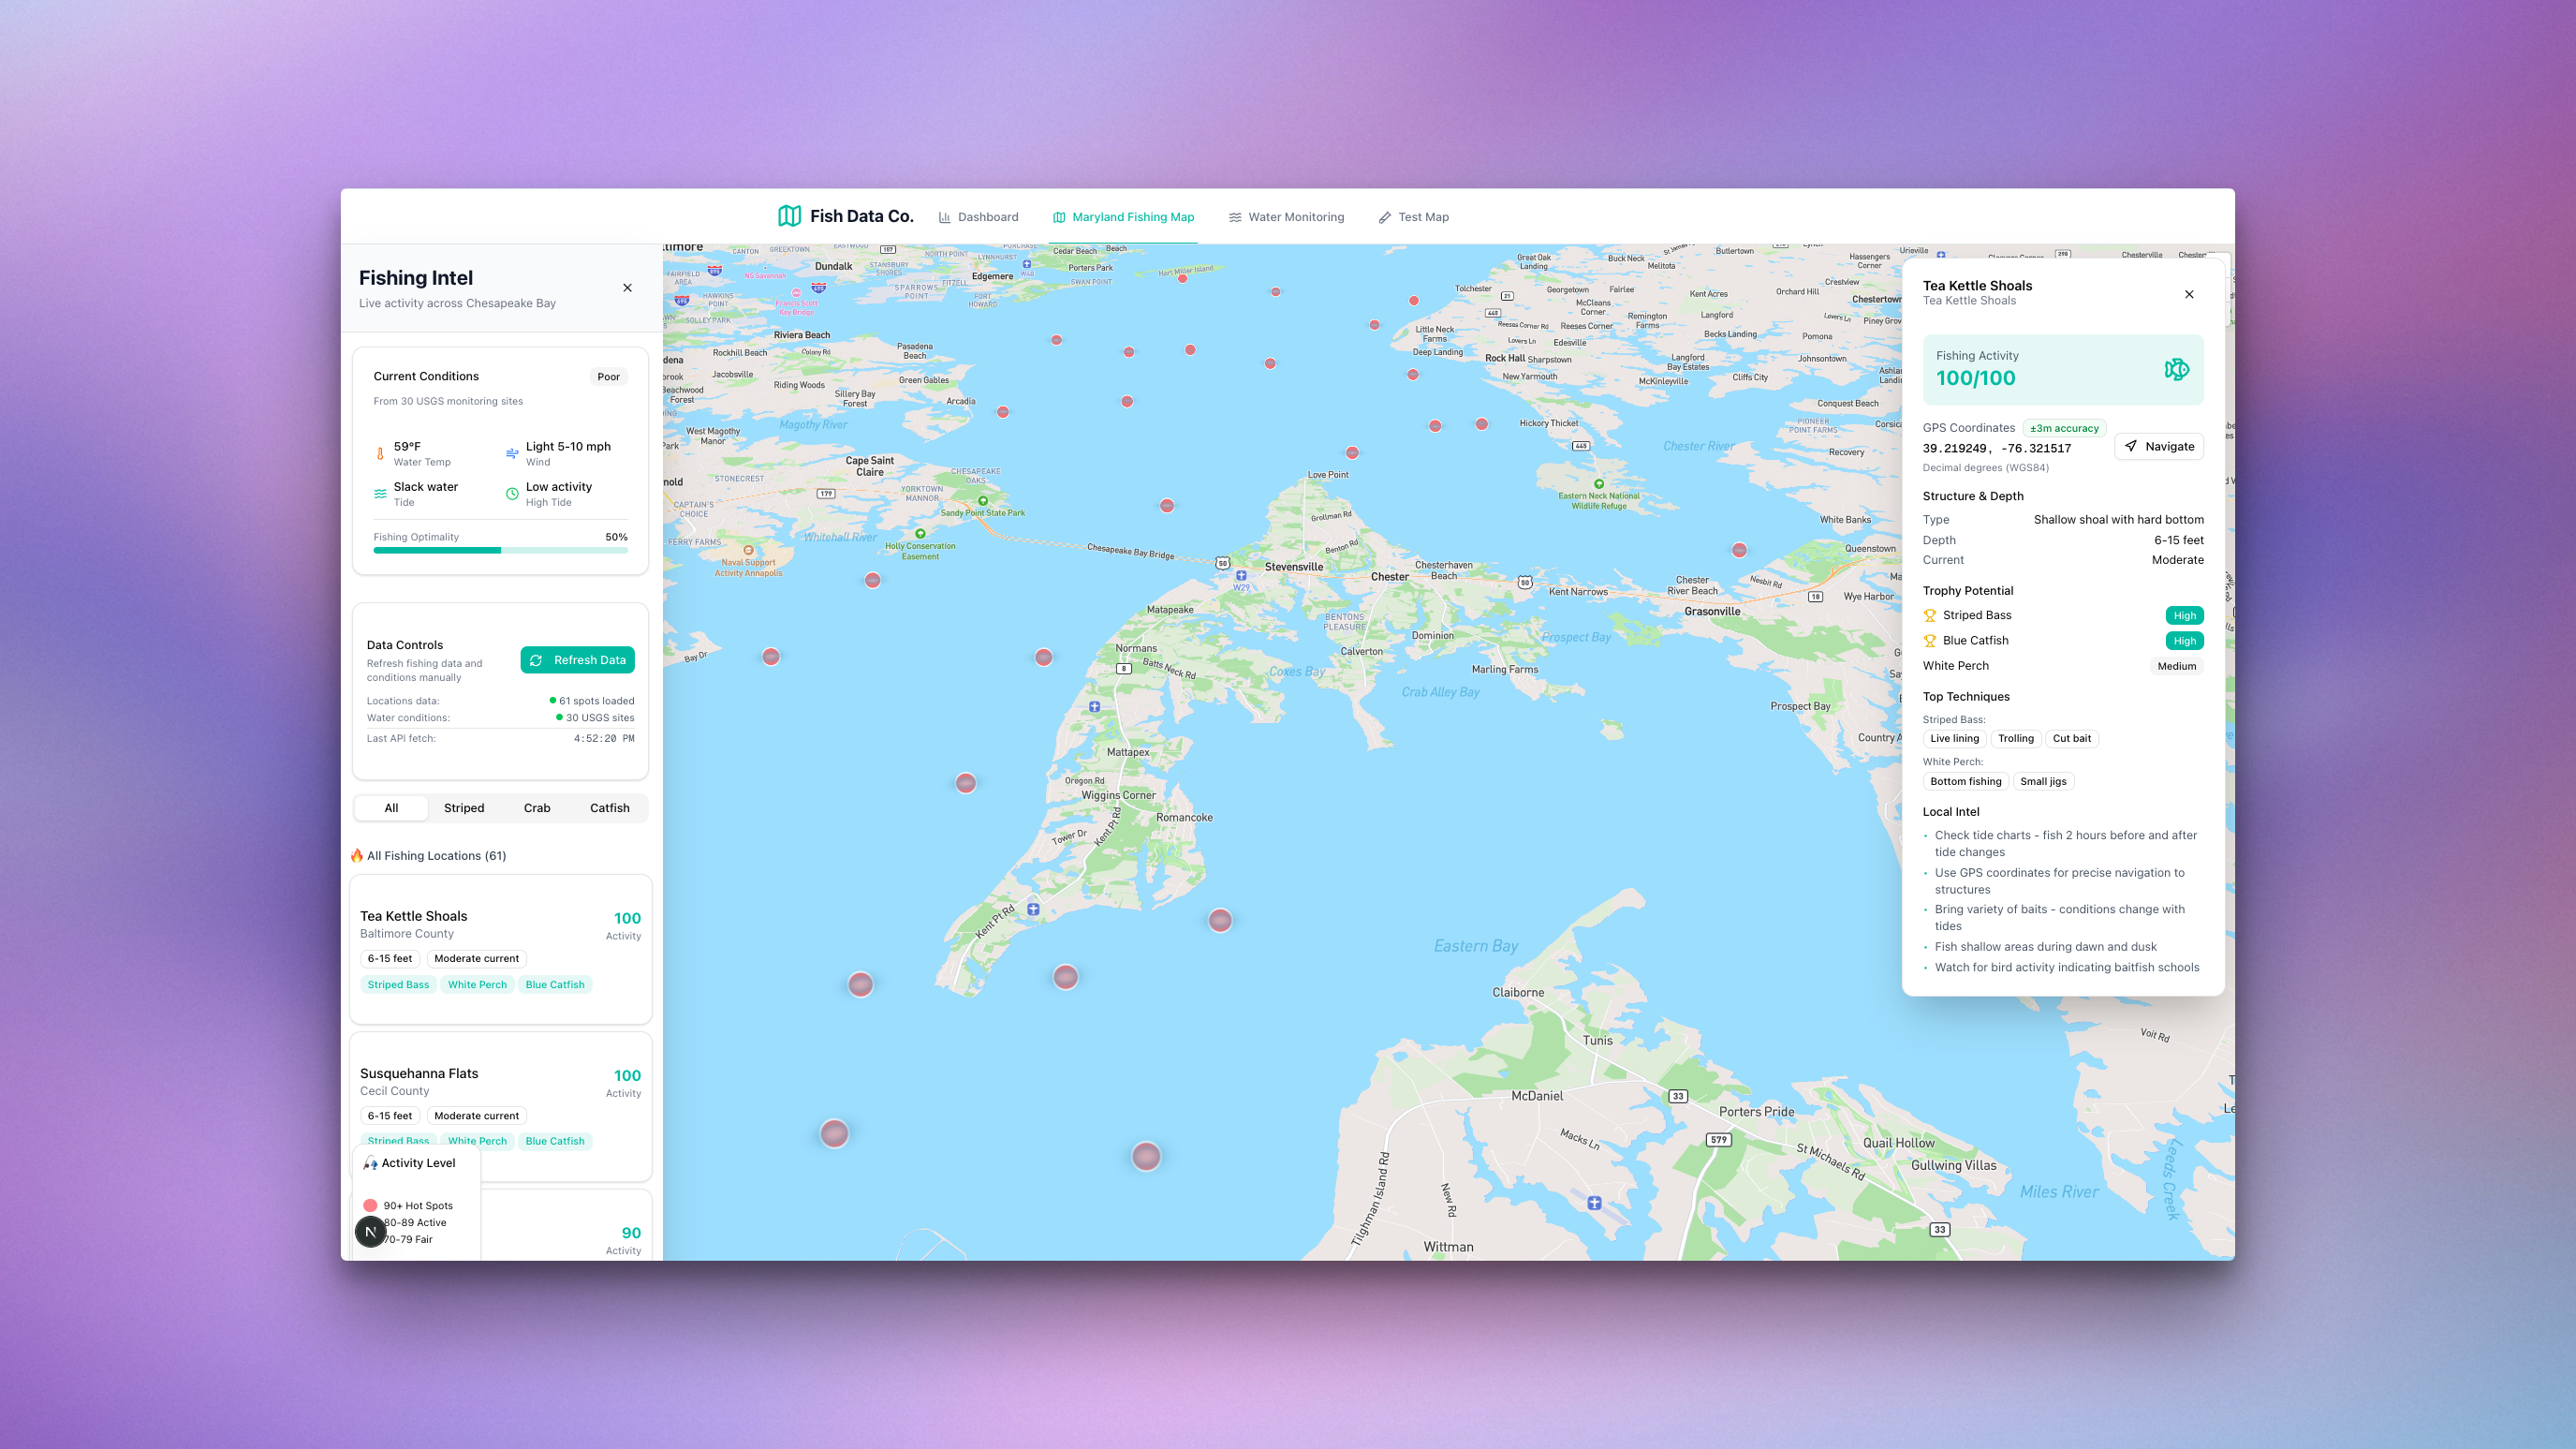
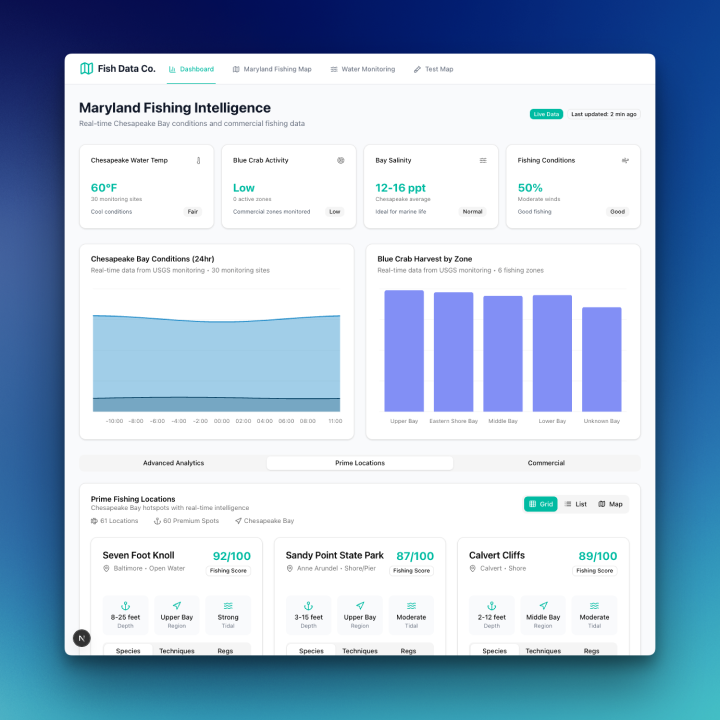
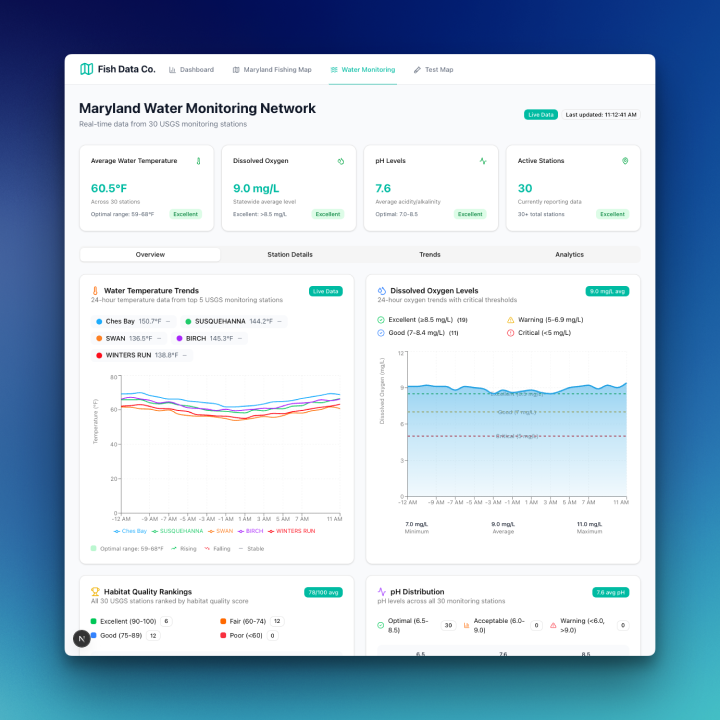
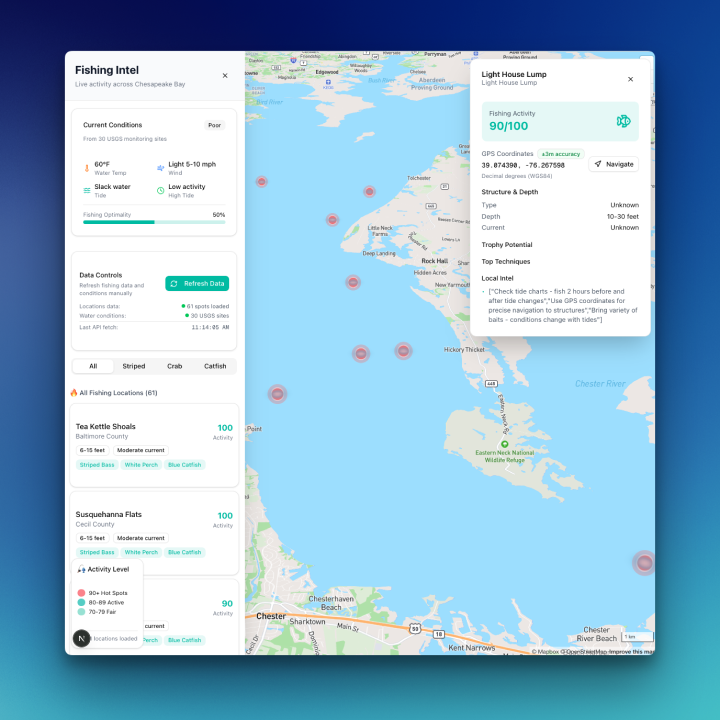
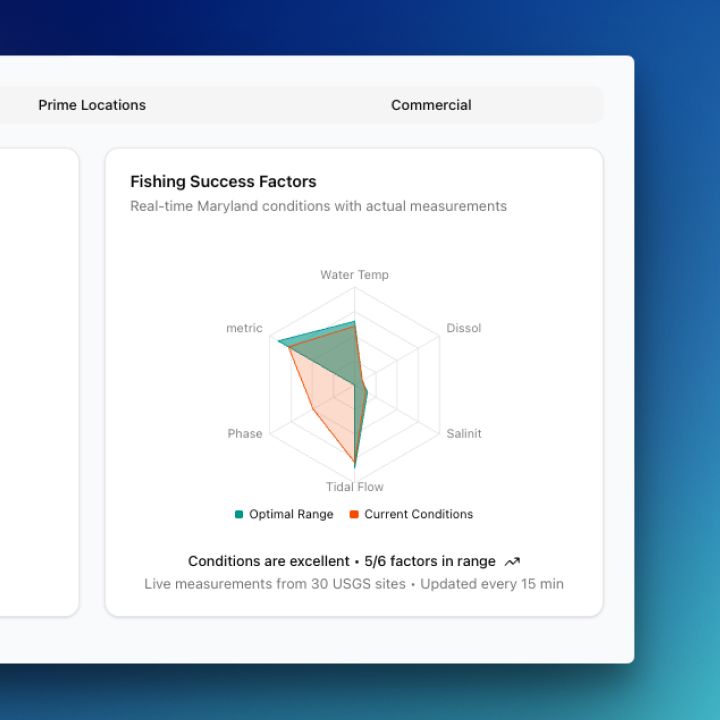
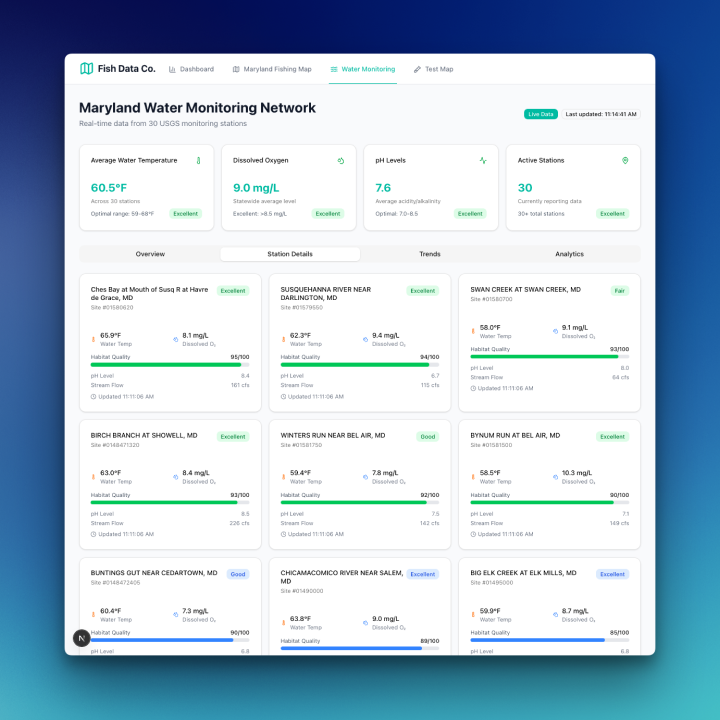
- Designed and demoed a Maryland dashboard to showcase data visualization.
- Created a Vercel-hosted landing page with Magic UI for visibility.
Impact: This project demonstrates that with the right workflow, anyone can go from idea to production — whether that’s an API, a Chrome extension, an AI app, or infrastructure — in days.
It proves the potential of AI-assisted building and opens the door for new hybrid roles across design and development.
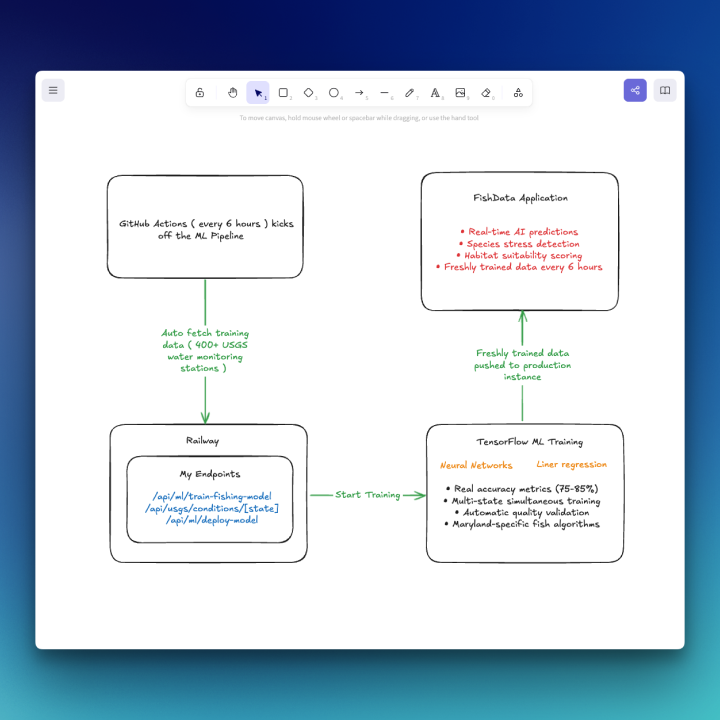
Next Steps: Building on the normalized APIs, I plan to incorporate machine learning models using USGS water data to predict water quality trends, detect algae blooms, and generate conservation insights.
Ready to build something extraordinary together?
Complex problems demand innovative solutions. Let's collaborate and transform your most challenging technical visions into reality.