Protect AI Guardian + Radius DS
I worked in parallel on scaling the Radius Design System which was a 0-1 project. Using the Atomic Design approach and driving adoption across an entire platform.
Project objectives and approach
Objective: Design an end‑to‑end experience that makes AI/ML model security understandable, trustworthy, and actionable for ML engineers, platform teams, and security analysts. Guardian should:
- Scan models across formats (e.g., TensorFlow, PyTorch, ONNX, LLM formats) and surface risks clearly.
- Enforce policies in developer workflows (local scans, CI/CD gates, pre‑download checks).
- Provide fast triage → remediation paths, auditability, and enterprise readiness.
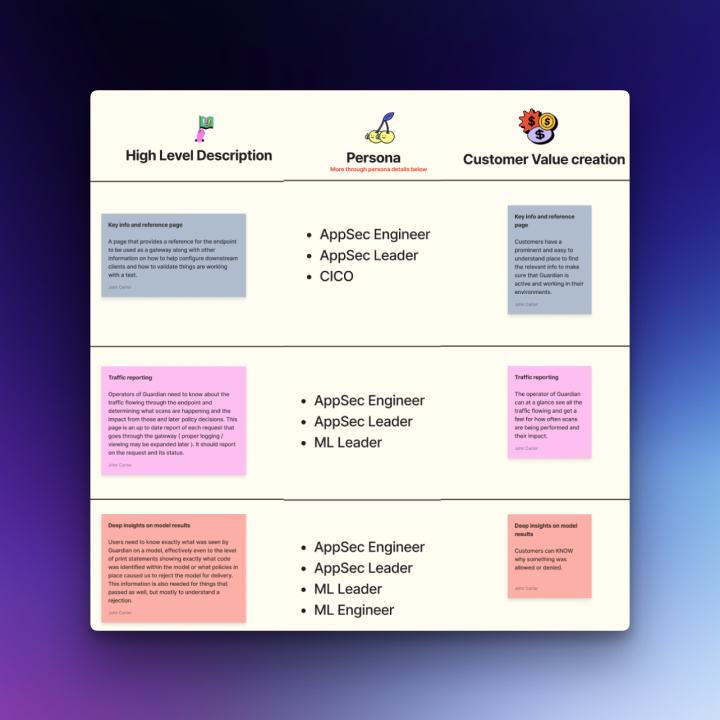
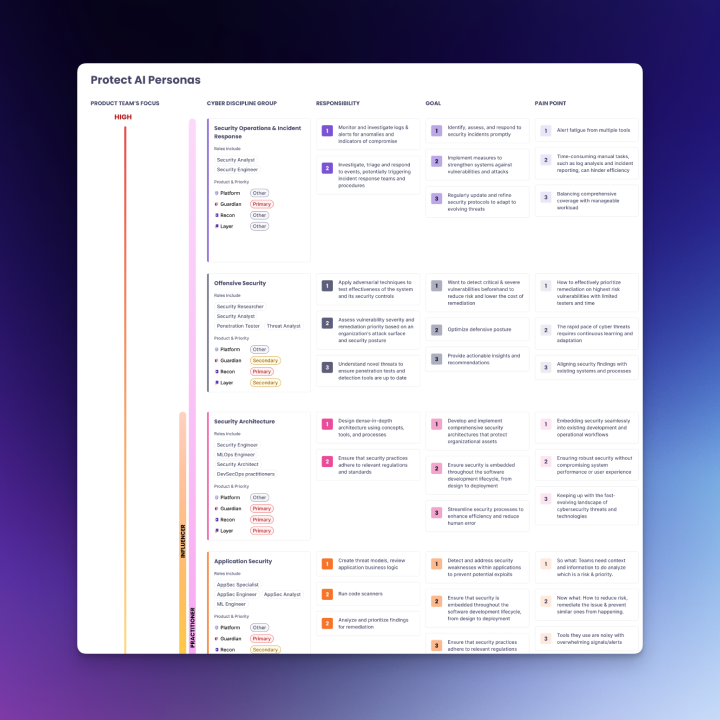
Target personas & jobs‑to‑be‑done
- ML Engineer: “Before I download or deploy a model, tell me if it’s risky and how to fix it.”
- Platform Engineer: “Automate checks in pipelines without slowing delivery.”
- Security Analyst: “Get reliable signal, reduce false positives, and prove we’re compliant.”
- Compliance Officer: “Show evidence that models meet internal and regulatory standards.”
Approach (UX)
- Discovery interviews, ecosystem audit (model hubs, CI tools), competitive teardown.
- Concept sketches → low‑fi wireframes (critical flows), IA & navigation model.
- Build Radius Design System (tokens, components, patterns) to unify app and docs.
- High‑fidelity prototypes with realistic data. Iterative usability tests.
- Partner closely with PM/Eng to define MVP scope, success metrics, and roadmap.
Technical architecture and implementation
- Entry points:
- Model detail (ad‑hoc scan, upload, or from hub link)
- CI/CD integration wizard (copy‑paste snippets, Docker local scanner)
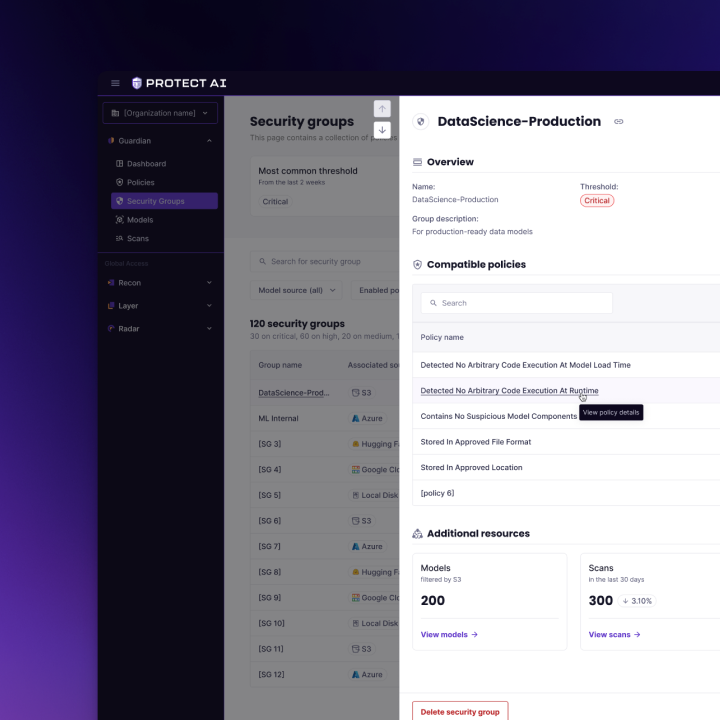
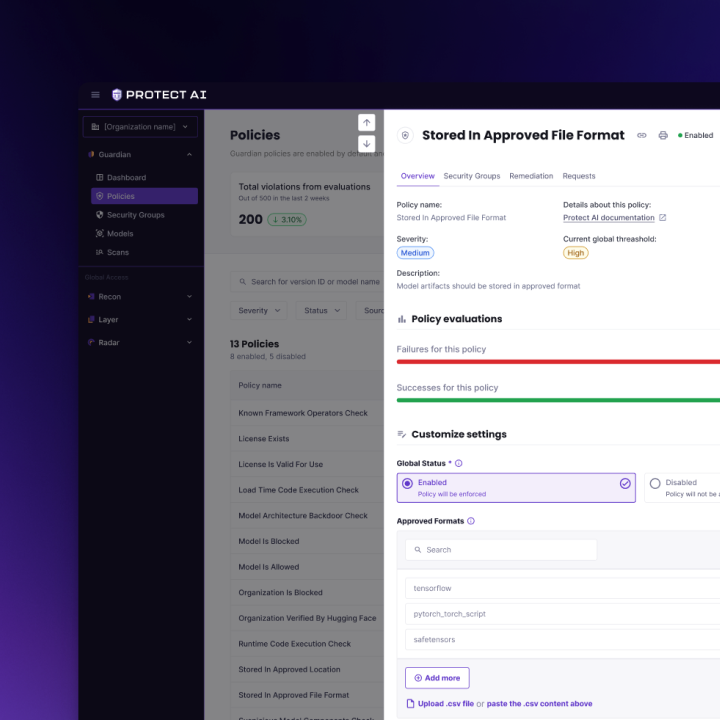
- Policy workspace (rules, severities, exceptions)
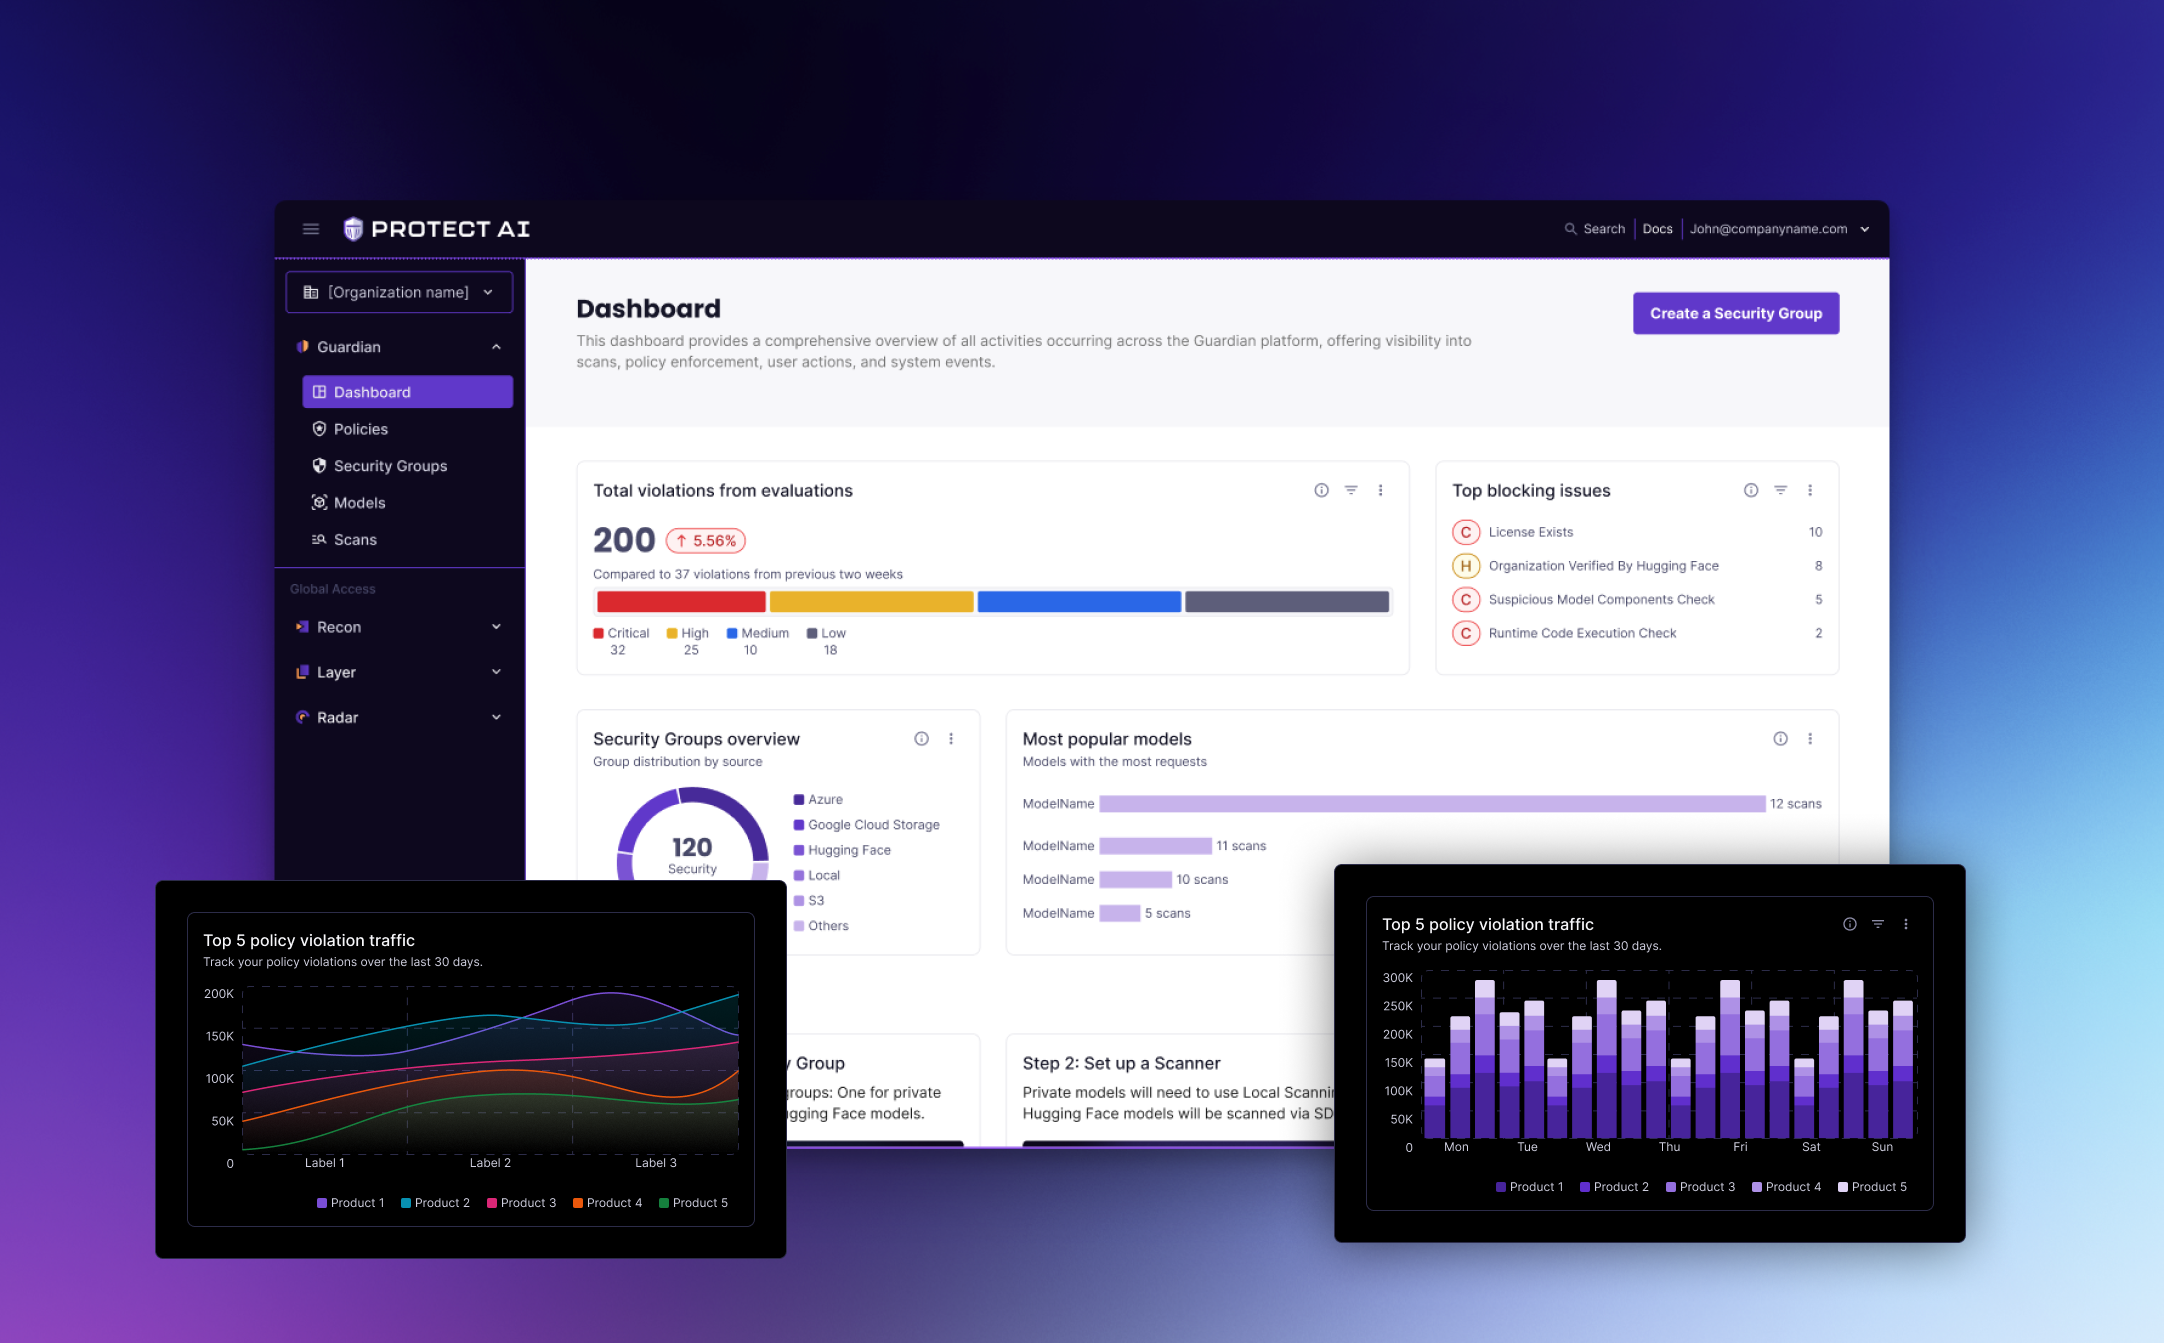
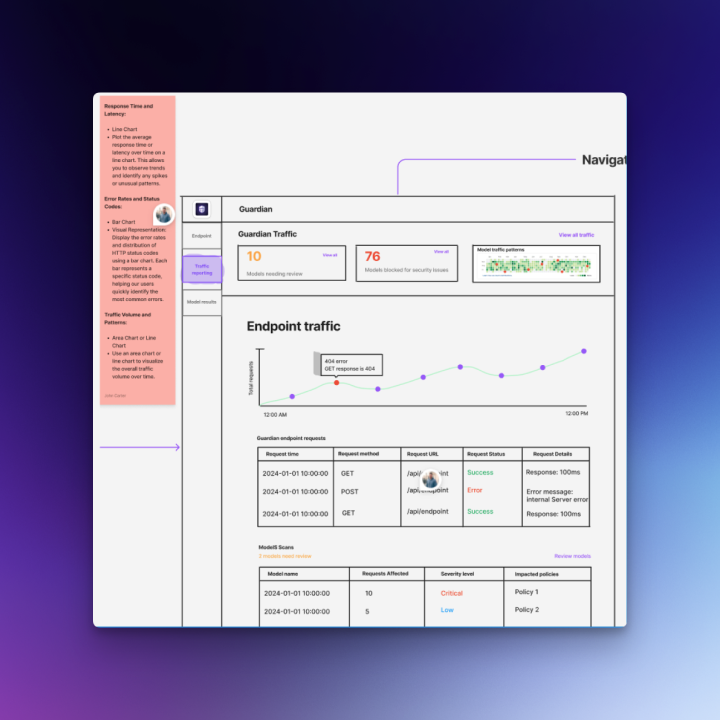
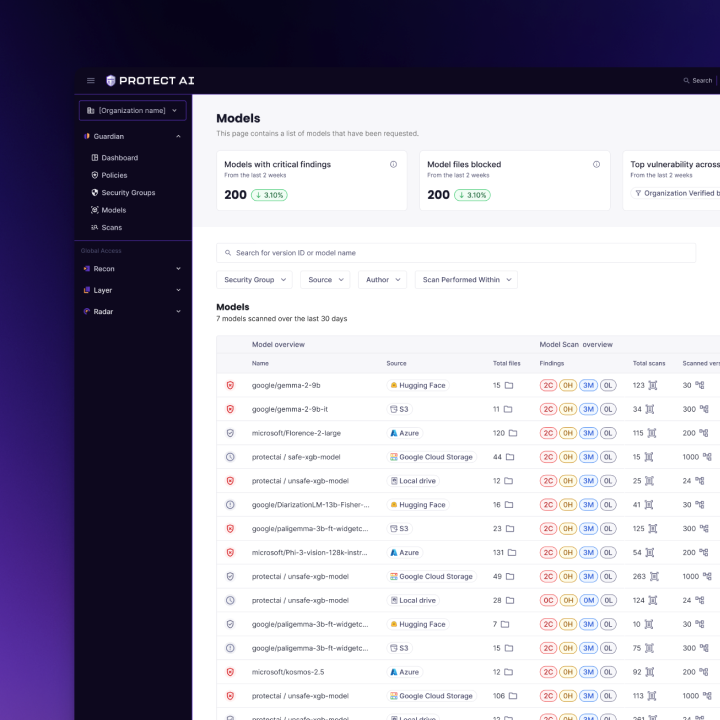
- Core modules: Dashboard, Model Scans, Policies, CI Integrations, Alerts, Audit & Reports, Settings.
- Navigation: Left rail (modules) + top utility (org/project switcher, environment, search, help).
Key flows I designed
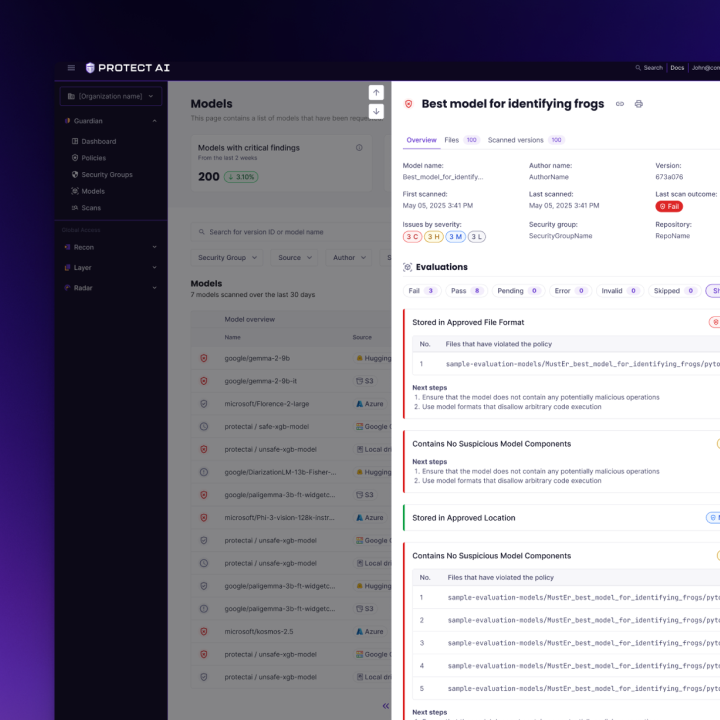
- Scan a model pre‑download → Results detail → Fix guidance → Approve/Quarantine.
- Set up CI enforcement → Pick template (GitHub Actions, GitLab, Jenkins) → Configure policy → Test run → Gate on severity.
- Policy authoring → Create rule (e.g., block unknown TF ops) → Scope to envs/projects → Review impact → Publish.
- Triage & remediation → Prioritized queue → Evidence panel (explain why flagged) → Assign → Track to resolution.
- Audit & reports → Time‑series of findings, SBOM/attestation export, policy drift report.
Prototype
- End‑to‑end clickable prototype covering: onboarding, first scan, CI setup, policy authoring, triage, and reporting.
- Data realism via seeded fixtures (35+ formats coverage, sample policies, typical findings).
- Handoff: component specs, token JSON, and usage guidelines for engineering.
Radius Design System
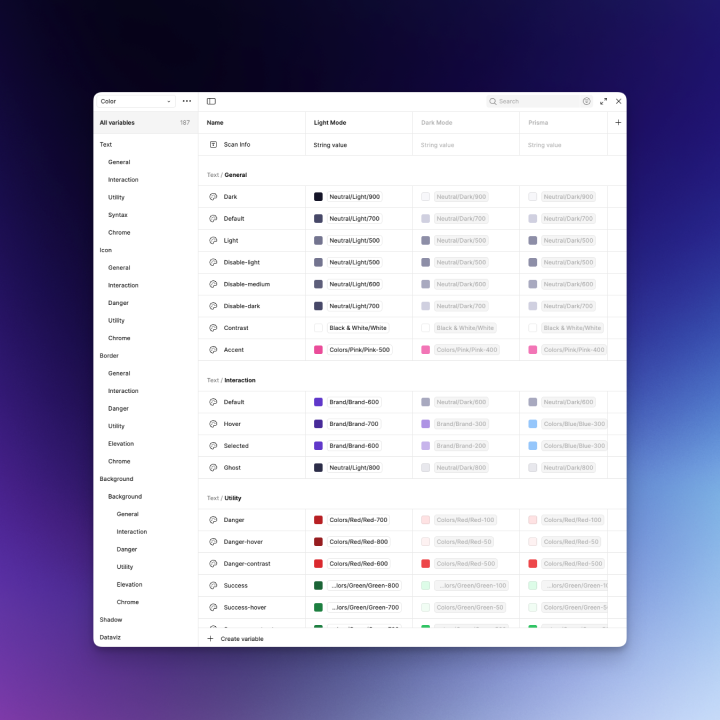
- Foundations: Design tokens (color/typography/space), light/dark themes, density scales, motion.
- Components: Primitives (Button, Input, Tabs, Table, Empty State), Complex (Scan Result Card, Finding Detail Drawer, Diff Viewer, Policy Builder, Rule Chips, Severity Badge, Status Timeline, Code Snippet with copy).
- Patterns: Progressive disclosure for technical depth, Inline explainers (“Why is this risky?”), Review & publish, Wizard setup, Zero‑state guidance.
- Accessibility: WCAG 2.2 AA color contrast, keyboard focus order, live regions for scan status, reduced motion option.
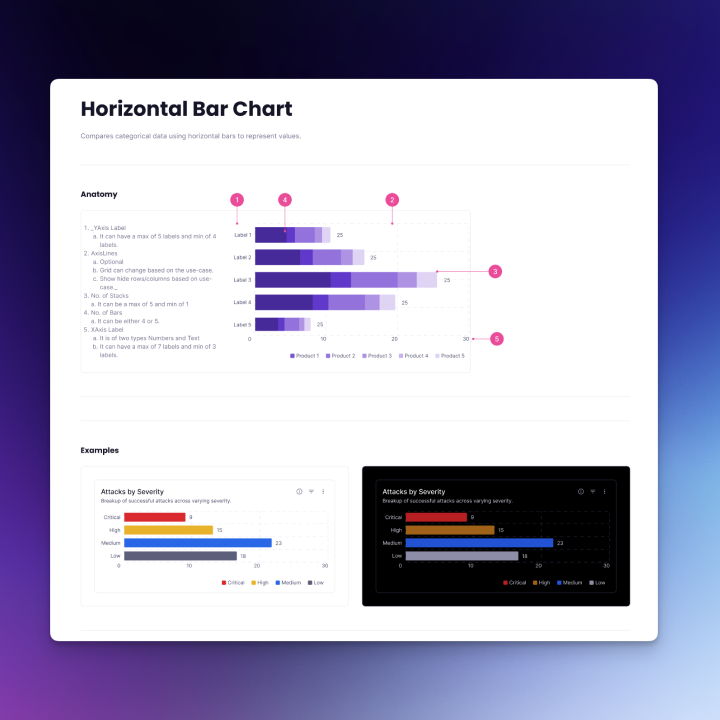
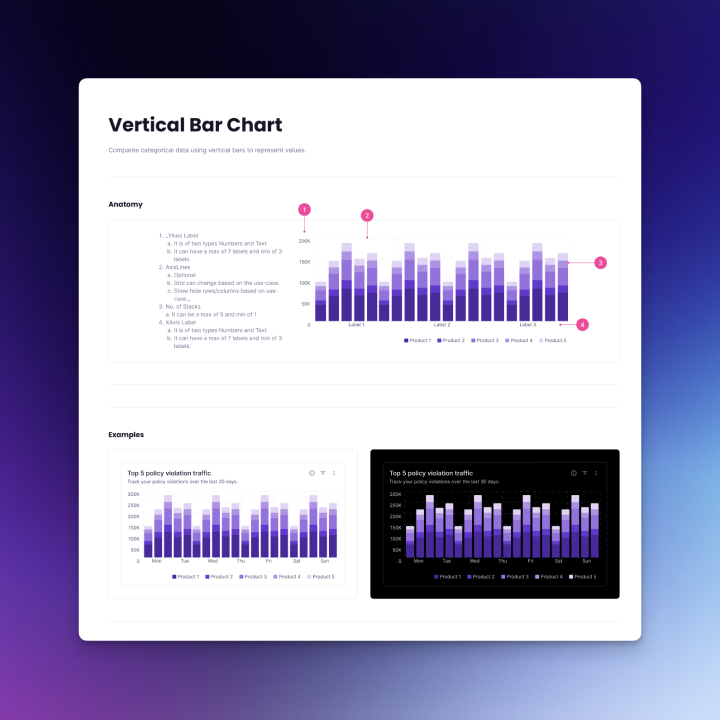
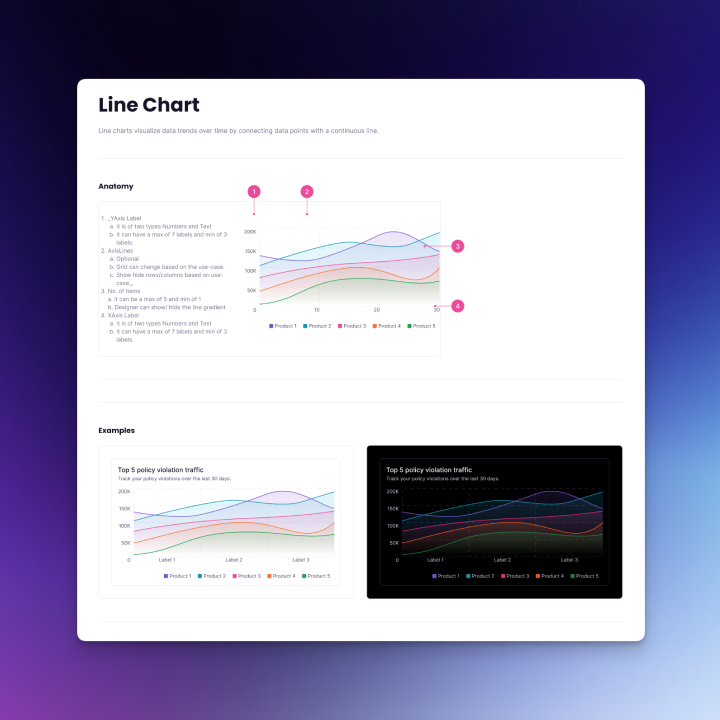
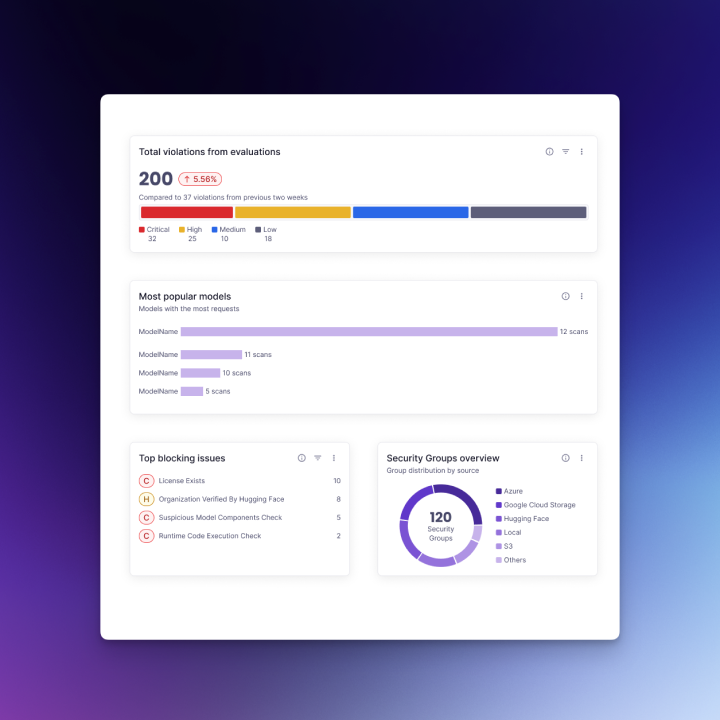
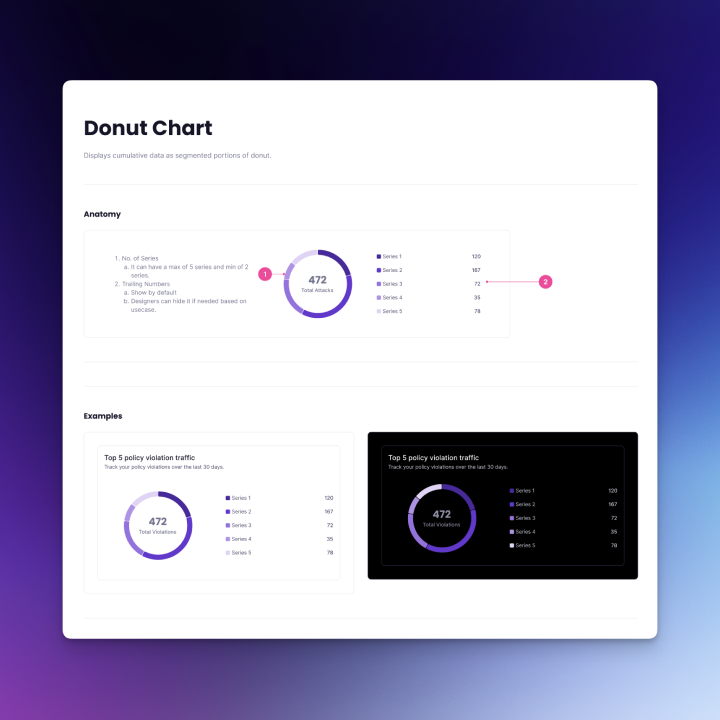
Data visualization components: To help users make sense of model scan results and policy trends, the Radius Design System also included reusable chart components.
I started with horizontal bar charts for comparing risk categories and severities, vertical bar charts for stacked comparisons, line charts for visualizing trends over time (e.g., vulnerabilities detected per week), and donut charts for proportional breakdowns (e.g., issue categories).
These were designed with clear labeling, tooltips for exact values, and accessibility in mind. In addition, the system defined color variables and tokens that allow designers to easily toggle between light and dark modes for all chart and UI components. These charts will be showcased as part of the visuals for this project.
Challenges and Solutions
Security + ML complexity is intimidating
- Challenge: Users span ML, Platform, and SecOps; jargon and mental models differ.
- Solution: Role‑based defaults (views & copy), glossary tooltips, and progressive disclosure—simple summaries first, deep technical drill‑downs when needed. Added inline “Explain this finding” with short rationale + link to deeper docs.
2. Signal vs. noise (false positives fatigue)
- Challenge: Security tools fail when users don’t trust results.
- Solution: Calibrated severity & confidence badges, grouped duplicates, and clear provenance (file, operator, line/offset). Provided “Why flagged” evidence and sample remediations. Enabled de‑dupe across pipelines and one‑click “mark as risk‑accepted with expiry.”
3. ‘Shift‑left’ without slowing delivery
- Challenge: CI gates can frustrate developers if slow or opaque.
- Solution: Designed a local scanner path (Docker) for fast pre‑commit checks, plus CI templates with estimated runtime and dry‑run mode. Added policy preview to show what would fail before enforcing.
4. Policy authoring is hard
- Challenge: Expressing complex security requirements in a friendly UI.
- Solution: Policy Builder with rule cards, natural language assist (“Block non‑standard TF ops”), scoping (env/project), and simulation (“show me projects affected”). Versioning + diff on publish.
5. Data density & readability
- Challenge: Scan results can be huge.
- Solution: Table virtualization, column presets per persona, smart grouping (by model, by vuln type), and a finding detail drawer with tabs (Summary, Evidence, Policy, Remediation, History).
6. Enterprise trust & auditability
- Challenge: Compliance teams need defensible evidence.
- Solution: Designed attestations/SBOM export, immutable audit log, and report templates (quarterly compliance, vendor review). Clear lineage from policy → scan → action.
Project Outcomes and Impact
- Clarity: Users reported faster understanding of “what’s wrong and what to do next.”
- Speed: Local scanning + CI templates reduced setup time; policy preview decreased accidental gate failures.
- Adoption: Role‑tailored defaults and better evidence improved trust in findings.
- Scalability: Radius DS accelerated new features and ensured consistency across app + docs.
Next steps
- Expand policy packs (industry baselines), deeper integrations (AWS Bedrock, popular MLOps stacks).
- Add team workflows (review queues, SLAs), and richer analytics (risk burn‑down, model hygiene score).
- Extend the DS to a public component library for partners.
Ready to build something extraordinary together?
Complex problems demand innovative solutions. Let's collaborate and transform your most challenging technical visions into reality.